Performance
Every core, disk and interface, on its own chart.
Activity Monitor totals disk and network activity for the whole Mac and keeps per-core graphs in a separate window. Tidix lists every device on one page, down to each core, each with its own live chart.
01 — Devices
Every device in one list, each with a live chart.
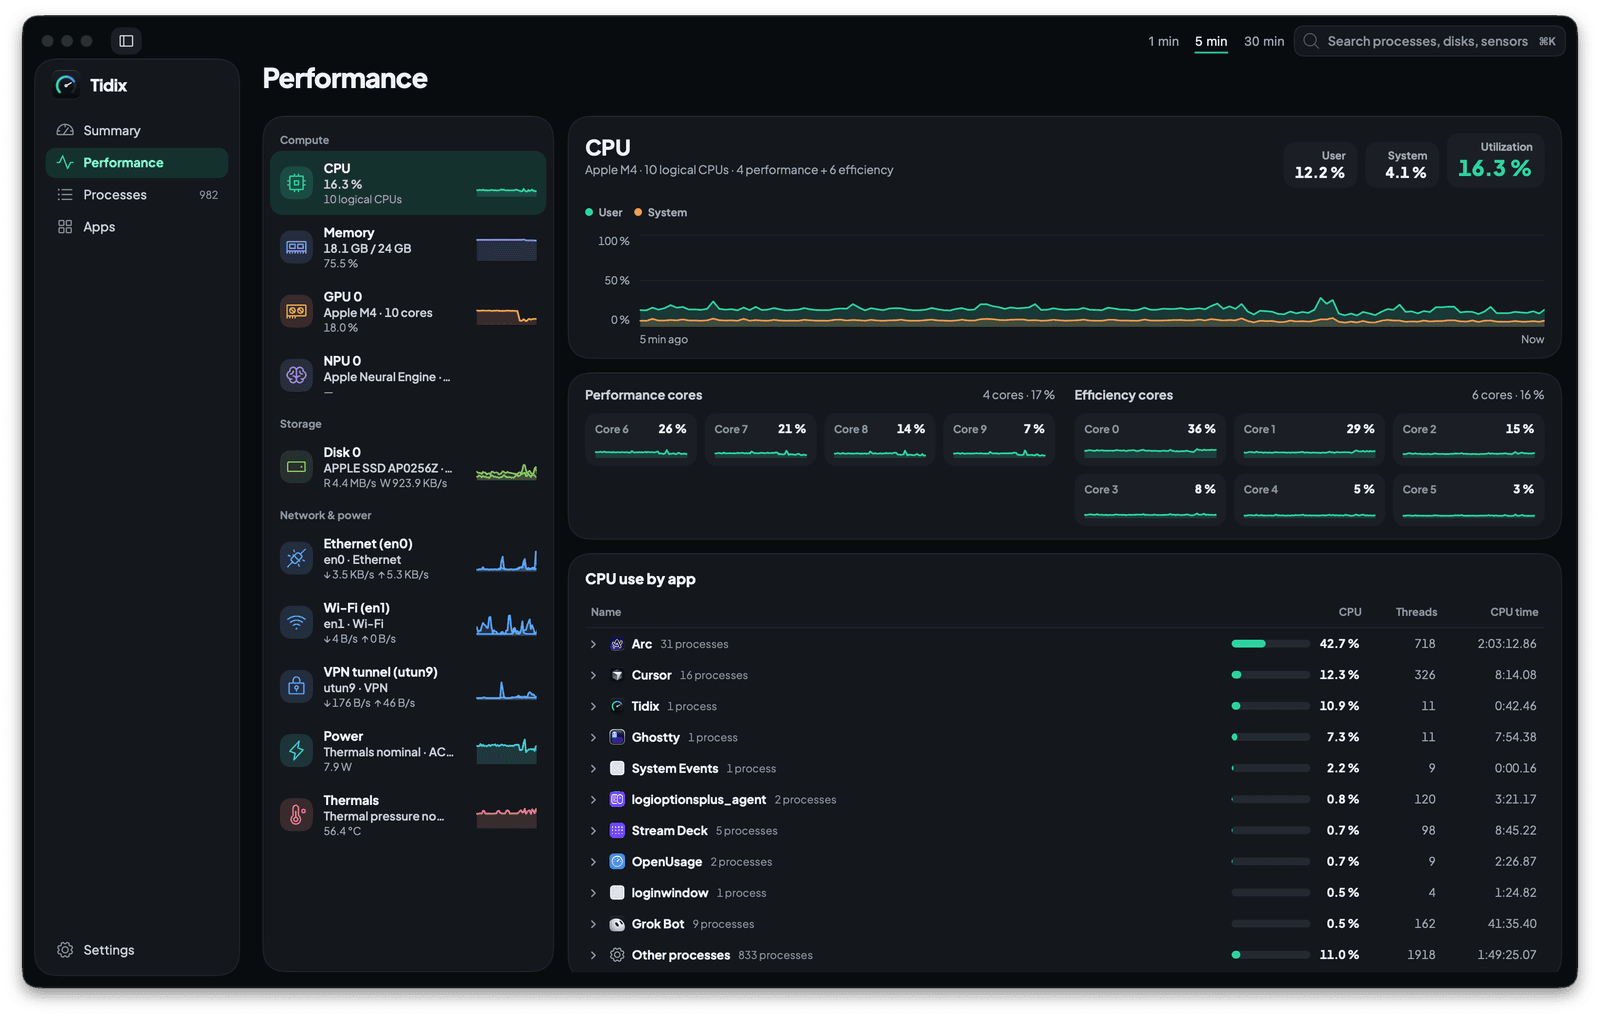
Performance lists your Mac's hardware in one column, and each row shows its current reading next to a small live chart, so the busy device stands out before you click. Select a row and its full chart opens beside the list, over the 1, 5 or 30 minutes you pick in the toolbar.
- Compute: CPU, Memory, GPU and, on Apple silicon, the Neural Engine.
- Storage: every physical disk, internal or external.
- Network & power: every network interface in use, then Power, Thermals and, on a Mac with a battery, Battery.
02 — Cores
Every core gets its own tile.
Select CPU and the main chart shows total load, with the kernel's System share drawn over it, next to the User, System and Utilization readings. Under it, each core has a tile with its load and a sparkline, grouped into performance cores and efficiency cores with each group's average. On an Intel Mac, every logical CPU sits in a single Cores group.
03 — Memory
Memory in use, pressure and paging on one screen.
Select Memory and the chart is drawn on the scale of the memory installed, so a full chart means full memory. Next to it, Tidix shows how much is in use and how much is still available.
- Pressure: the memory pressure level macOS reports: normal, warning or critical.
- Paging: a chart of page-ins and page-outs per second.
- Memory usage: memory in use over the last 30 days, from the saved metrics history.
04 — Disks, network
Each disk and each interface on its own chart.
Activity Monitor's Disk and Network tabs add up the whole Mac. Tidix gives every physical disk its own row and a read and write chart, and every interface in use, such as Wi-Fi, Ethernet or a VPN tunnel, its own row and a download and upload chart. Network speeds follow your choice of bytes or bits per second in Settings, while disk speeds stay in bytes.
05 — Apps
The apps behind each device, helpers included.
Below the charts, CPU, Memory, Power, each disk and each interface list the ten apps using them most. A helper process counts toward the app it belongs to, and processes outside any app share an Other processes row. Click an app to open its App details, or use the triangle next to it to see its processes.
- CPU: CPU, threads and CPU time per app.
- Memory: memory per app. Power: power draw per app.
- Disks: reads and writes per app, across all disks.
- Network: download and upload per app, across all interfaces.
Why it matters
Before and after
With Activity Monitor
Your Mac feels slow. In Activity Monitor you sort the CPU tab, open Window › CPU History to see the cores, switch to the Memory tab for its pressure graph, then check the Disk and Network tabs, whose totals cover the whole Mac. Finding the app behind a spike means sorting each tab's list of processes.
With Tidix
In Tidix you open Performance and the device list already shows which device is busy. Click it to see its chart, its cores or its paging, and the apps using it, each with its helpers counted in, on one screen.
How to use it
Where it is in Tidix
- Click Performance in the sidebar, or choose View › Performance (
⌘2). - Pick a device in the list: disks are under Storage, network interfaces under Network & power.
- Set how far back the charts go with 1 min, 5 min or 30 min in the toolbar.
- From Summary, click the CPU, Memory, GPU, Temperature, Network or Disk card to open that device here.
Compared
Performance: Activity Monitor and Tidix
| What | Activity Monitor | Tidix |
|---|---|---|
| Per-core load | Window › CPU History opens a separate window with a graph per core. | A tile per core under the CPU chart, grouped into performance and efficiency cores. |
| Memory | The Memory tab has the Memory Pressure graph and figures such as Memory Used and Swap Used. | Memory in use over 1, 5 or 30 minutes, the pressure level, a paging chart and the last 30 days. |
| GPU | Window › GPU History opens a graph of GPU use. | A GPU chart with an Engines view for renderer and tiler, and a chart of GPU memory in use. |
| Disks | The Disk tab totals reads and writes for the whole Mac. | Each physical disk has its own row and read and write chart. |
| Network | The Network tab totals traffic for the whole Mac. | Each interface in use, such as Wi-Fi, Ethernet or a VPN tunnel, has its own row and chart. |
| Apps behind the load | Each tab lists processes; click a column to sort them. | CPU, memory, power, disks and network list their top apps, helpers counted in. |
The words behind it
- Logical CPU
A processor that macOS can schedule work on. On Apple silicon each core is one logical CPU, while an Intel core with Hyper-Threading counts as two; Tidix draws a tile for each one.
- Performance cores
The fast, more power-hungry cores of an Apple silicon chip, which take on demanding work. Tidix groups their tiles under Performance cores, with the group's average load.
- Efficiency cores
The low-power cores of an Apple silicon chip, which macOS uses for background and lighter work. Tidix groups their tiles under Efficiency cores, with the group's average load.
- Memory pressure
How hard macOS has to work to keep memory free, for example by compressing it or moving it to disk. Tidix shows the level macOS reports: normal, warning or critical.
- Paging
How macOS moves memory pages between RAM and storage: a page-in reads a page from disk, and a page-out writes one out to make room. Steady page-outs are a sign that memory is running short.
- Hotspot temperature
The hottest reading among a chip's temperature sensors at a given moment. Tidix's Thermals chart follows it: the hottest SoC sensor on Apple silicon, the hottest CPU or GPU sensor on an Intel Mac.
Questions
Does Tidix show each CPU core separately?
Yes. Select CPU and each core gets a tile under the main chart with its load and a sparkline. On Apple silicon the tiles are grouped into performance and efficiency cores; on an Intel Mac they form one group, with a tile per logical CPU.
How far back do the charts go?
Up to 30 minutes: pick 1 min, 5 min or 30 min in the toolbar. The charts fill from the readings Tidix already kept while running, so a longer span shows its past right away. Memory also has a 30-day chart from the saved metrics history.
Can I see which app is using my disk or network?
Yes. Each disk lists the apps reading and writing the most, and each interface the apps downloading and uploading the most. Tidix counts an app's activity across all disks and all interfaces, which is why the titles of these lists say so.
Why does an app show more than 100% CPU?
By default, an app's CPU is measured against one core, so an app busy on two cores reads 200%. To make 100% mean every core busy, choose Whole Mac under Settings › General › Units › CPU per app.
What do Power, Thermals and Battery show?
Power charts your Mac's power draw in watts and lists the apps drawing the most. Thermals charts the hotspot temperature and shows the thermal pressure macOS reports. On a Mac with a battery, Battery charts its charge and the power flowing in or out.
Does Performance work on Intel Macs?
Yes. Since version 1.1.0, Tidix runs on Intel Macs with macOS 13 or later. Performance lists the same devices there, except the Neural Engine, which only Apple silicon has.
Keep reading
More of Tidix
Processes
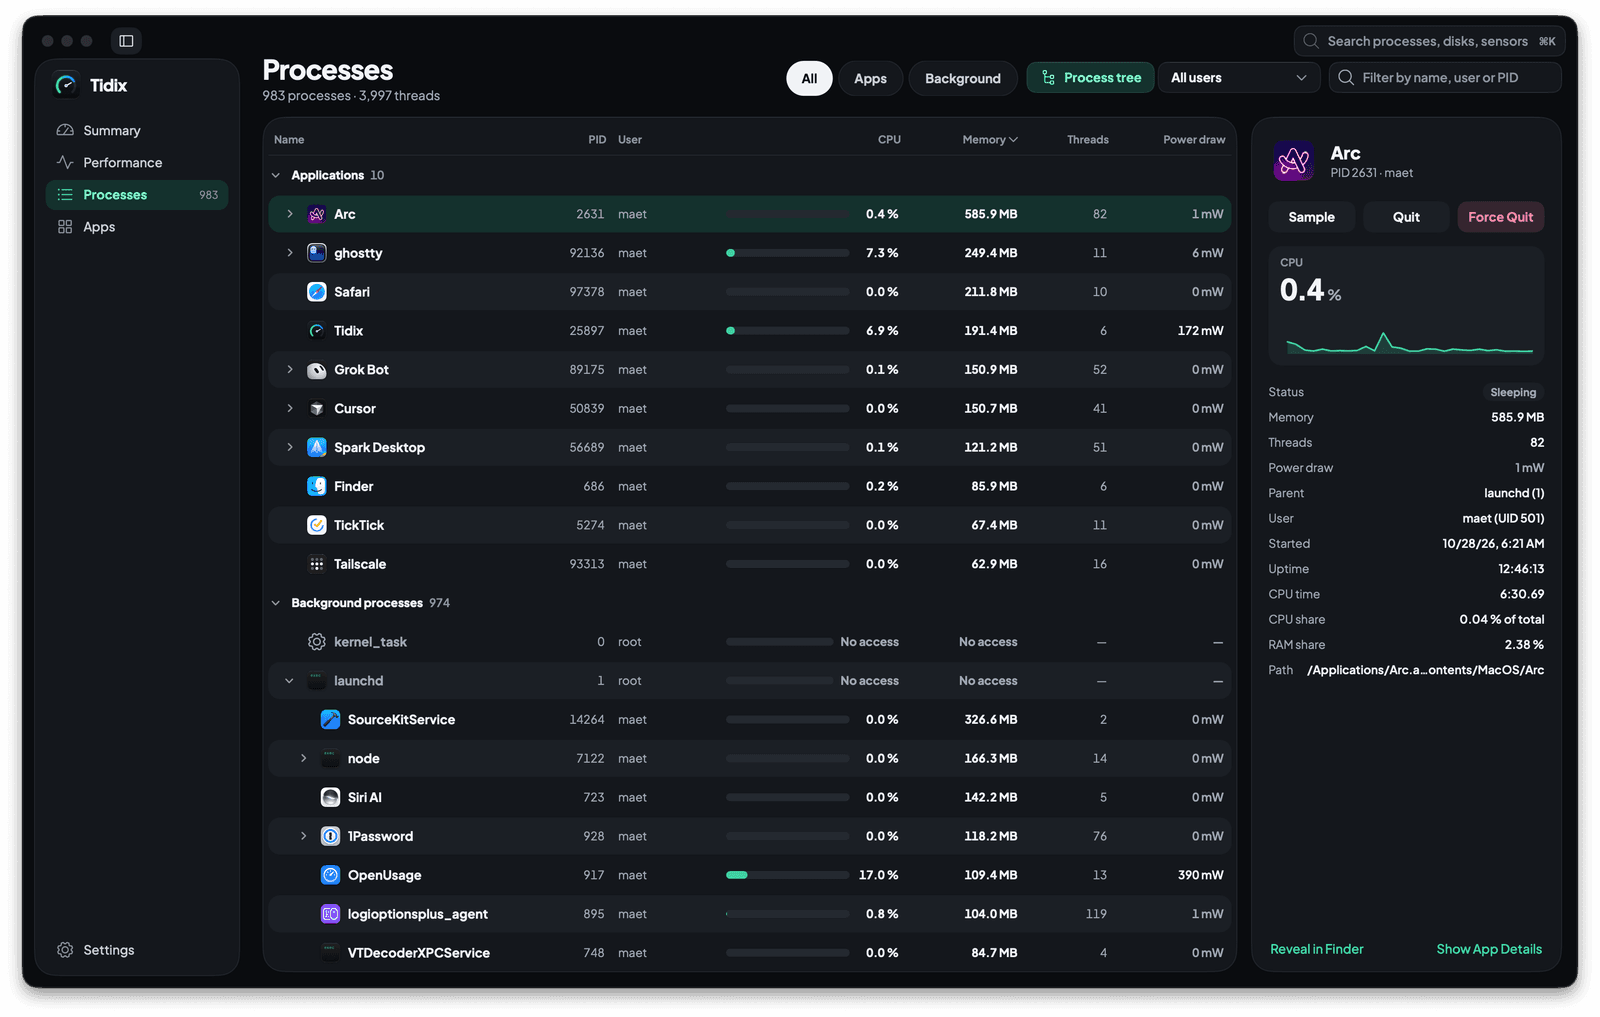
Every process in a tree with its CPU, memory and power draw, ready to quit, pause or sample.
See how it works
Apps
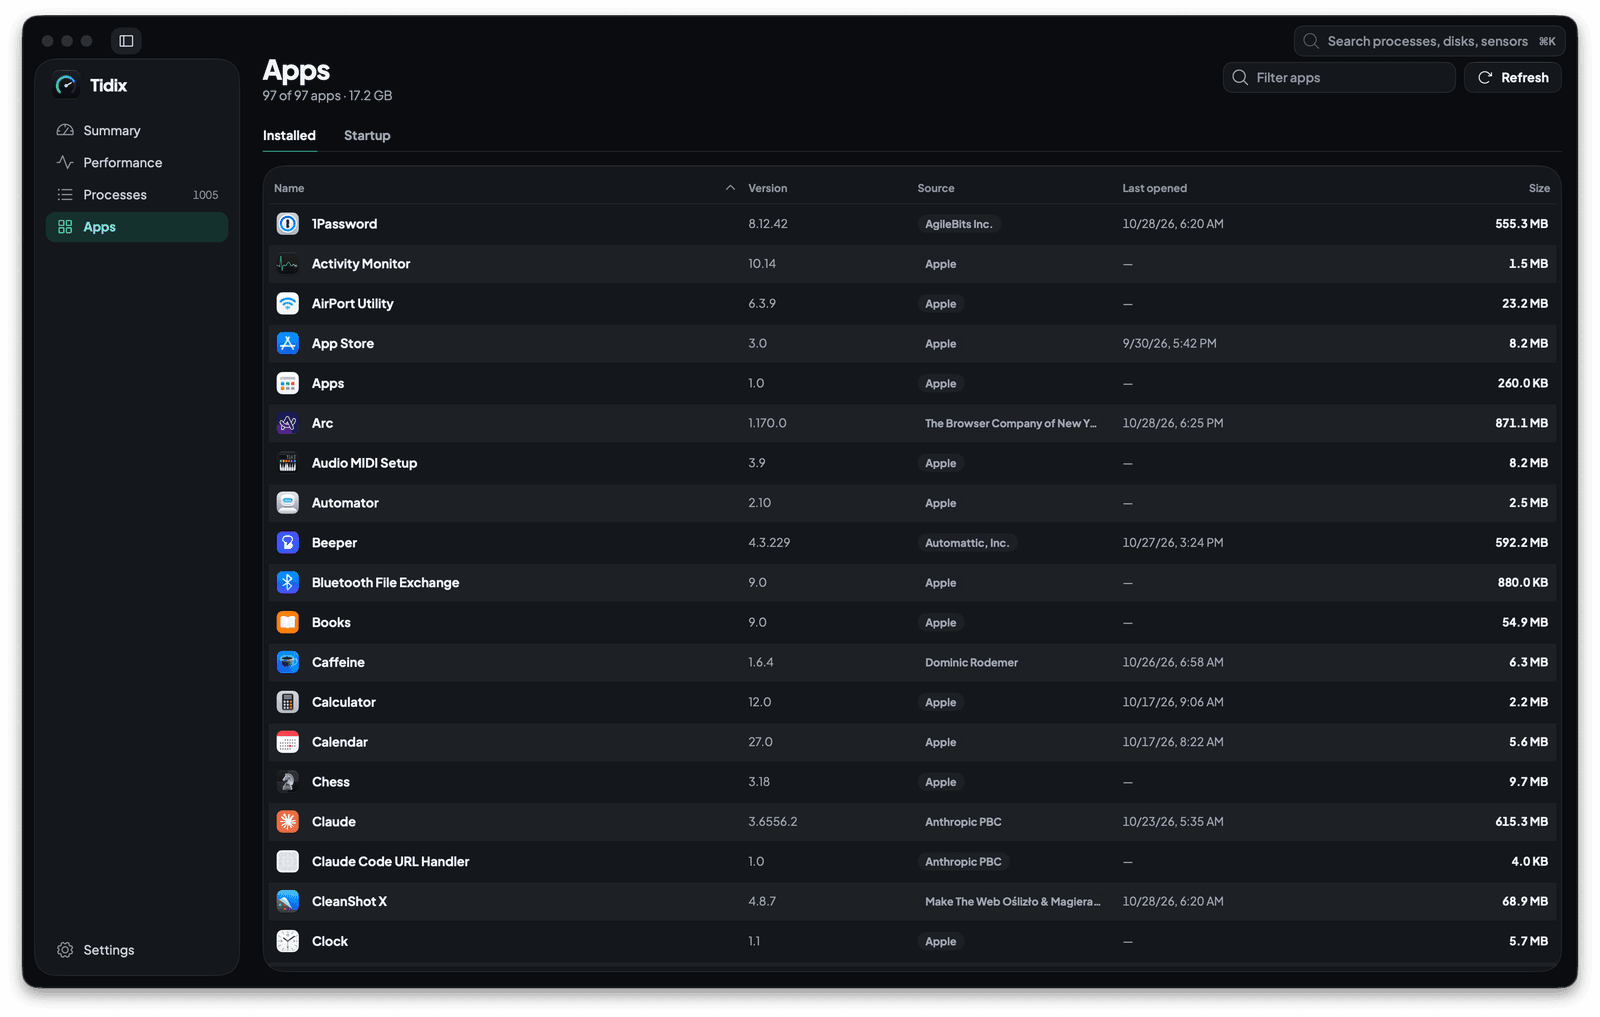
Every app on your Mac with its version, source and size, and everything set to start on its own.
See how it works
App details
Click any app for its processes, usage, 30 days of history and related files, and uninstall it to the Trash.
See how it works
Bluetooth
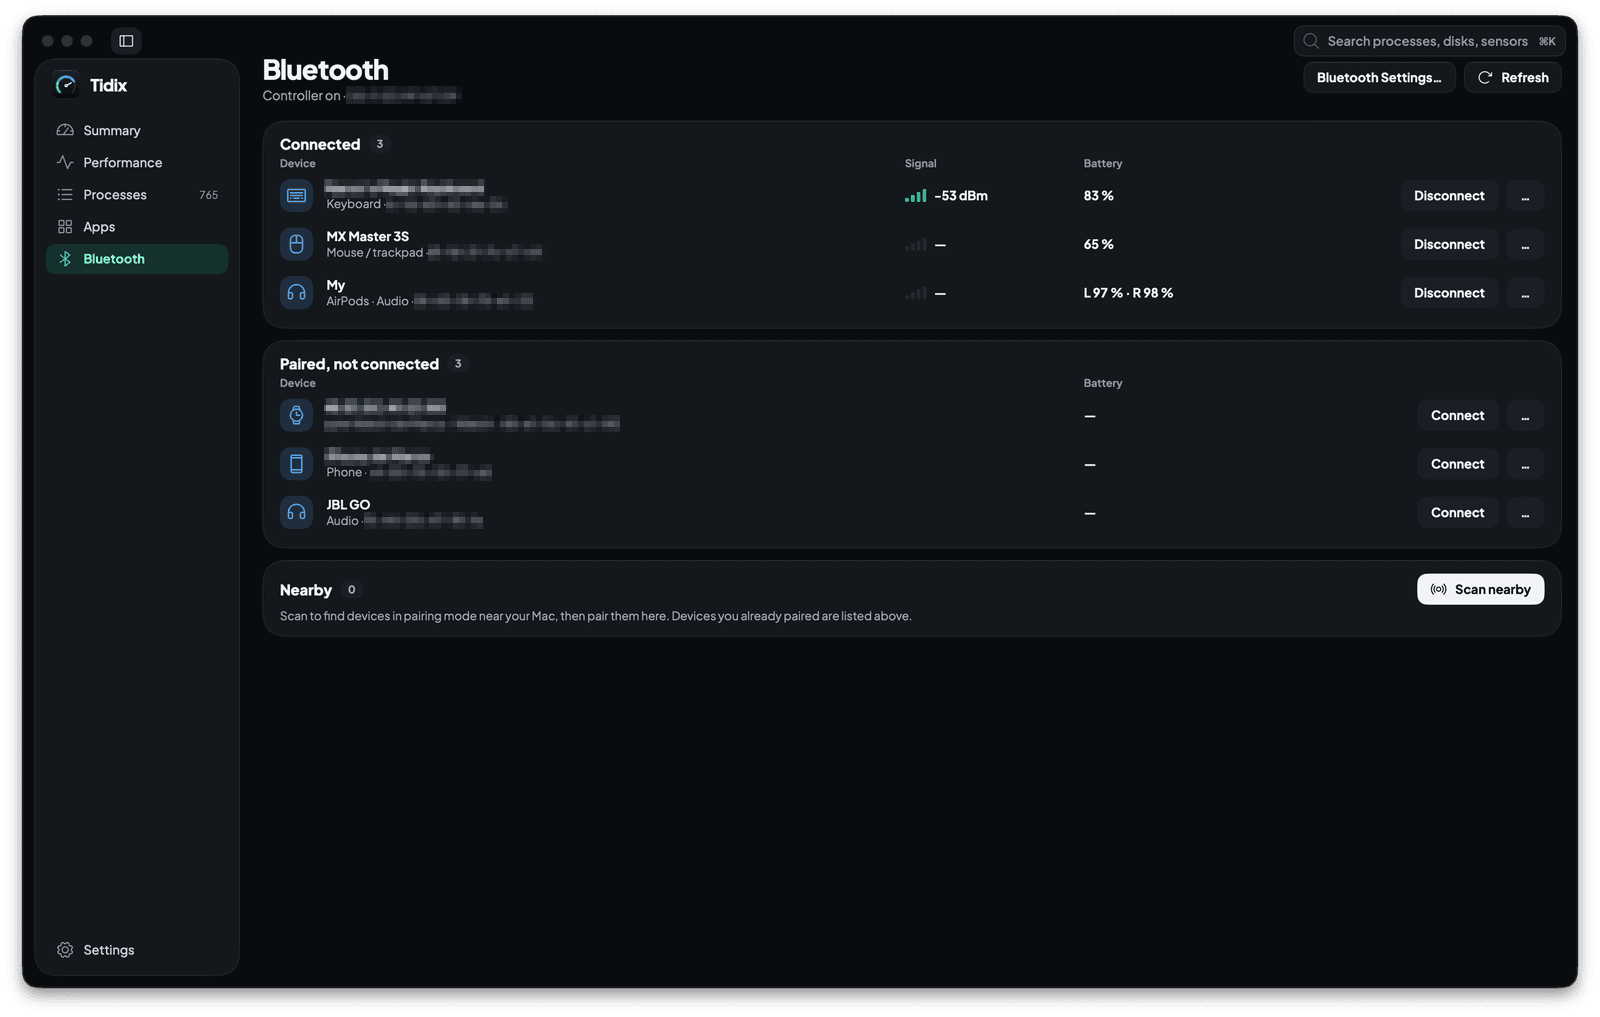
Every paired device with its type, signal and battery. Connect, rename, forget or pair one from the same page.
See how it works
Stop guessing. Start seeing.
Every core, sensor, disk, and process on your Mac, in one native app you pay for once.
Buy Tidix — from $5One-time purchase · 14-day refund · macOS 13 or later